Multiple Choice
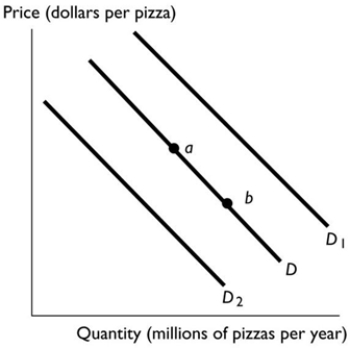 In the above figure, the movement from point a to point b reflects
A) an increase in the number of people who eat pizza.
B) a decrease in the price of pizza.
C) an increase in the demand for pizza.
D) an increase in the price of the tomato sauce used to produce pizza.
E) a decrease in the number of firms producing pizza.
Correct Answer:

Verified
Correct Answer:
Verified
Q67: The law of supply states that, other
Q68: Suppose over the next few years the
Q69: Assume that pizza and tacos are substitutes,
Q70: Changes in which of the following factors
Q71: An increase in the number of fast-food
Q73: An increase in the number of producers
Q74: When there is a shortage of parking
Q75: <img src="https://d2lvgg3v3hfg70.cloudfront.net/TB7671/.jpg" alt=" The graph illustrates
Q76: <img src="https://d2lvgg3v3hfg70.cloudfront.net/TB7671/.jpg" alt=" In the figure
Q77: If the demand curve for desktop computers