Multiple Choice
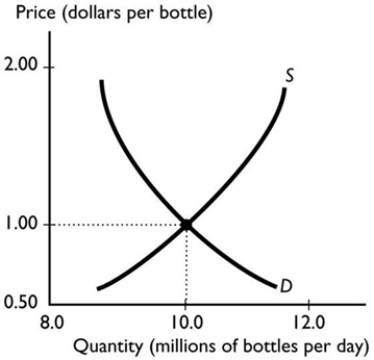 The graph illustrates the market for bottled water. When the price exceeds the equilibrium price, the quantity demanded is ________ the quantity supplied and the price of the good will ________.
A) equal to; fall
B) greater than; fall
C) less than; fall
D) greater than; rise
E) less than; rise
Correct Answer:

Verified
Correct Answer:
Verified
Q70: Changes in which of the following factors
Q71: An increase in the number of fast-food
Q72: <img src="https://d2lvgg3v3hfg70.cloudfront.net/TB7671/.jpg" alt=" In the above
Q73: An increase in the number of producers
Q74: When there is a shortage of parking
Q76: <img src="https://d2lvgg3v3hfg70.cloudfront.net/TB7671/.jpg" alt=" In the figure
Q77: If the demand curve for desktop computers
Q78: <img src="https://d2lvgg3v3hfg70.cloudfront.net/TB7671/.jpg" alt=" The above figure
Q79: Consider the market for smart phones. Which
Q80: <img src="https://d2lvgg3v3hfg70.cloudfront.net/TB7671/.jpg" alt=" The figure above