Multiple Choice
The following diagrams show the production possibilities boundaries for Austria and Switzerland,for the production of bicycles and shoes. 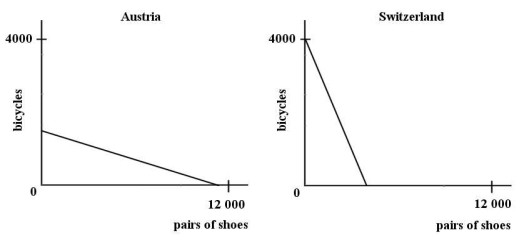 FIGURE 32-2 Refer to Figure 32-2.The diagrams illustrate that the ________ is lower in Austria than in Switzerland.
A) opportunity cost of producing shoes
B) opportunity cost of producing bicycles
C) total cost of producing shoes
D) average cost of producing bicycles
E) comparative advantage in producing bicycles
Correct Answer:

Verified
Correct Answer:
Verified
Q23: Consider the gains from trade.What is the
Q24: This table shows how much wine and
Q25: According to David Ricardo's principle of comparative
Q26: The following production possibilities schedule shows the
Q27: The hypothesis that the price of some
Q29: The following production possibilities schedule shows the
Q30: This table shows how much cotton and
Q31: Consider the possibility of trade between countries.When
Q32: Suppose two countries each produce wool and
Q33: The diagram below shows the domestic demand