Multiple Choice
This table shows how much wine and cheese can each be produced in Spain and Portugal with one unit of equivalent resources.Initially there is no trade.Once trade opens up,transportation costs are assumed to be zero. 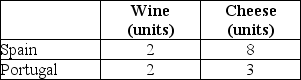 TABLE 32-5 Refer to Table 32-5.The comparative advantage in wine is held by
A) Spain.
B) Portugal.
C) both countries.
D) neither country.
E) Insufficient information to determine the answer.
Correct Answer:

Verified
Correct Answer:
Verified
Q19: The diagram below shows Robinson Crusoe's annual
Q20: The following production possibilities schedule shows the
Q21: The diagram below shows the (hypothetical)demand and
Q22: When specialization according to comparative advantage also
Q23: Consider the gains from trade.What is the
Q25: According to David Ricardo's principle of comparative
Q26: The following production possibilities schedule shows the
Q27: The hypothesis that the price of some
Q28: The following diagrams show the production possibilities
Q29: The following production possibilities schedule shows the