Multiple Choice
The table below shows the percentage of the labour force accounted for by males and females over a two-decade period.Assume that real GDP is equal to potential in each of the given years. % of Labour Force 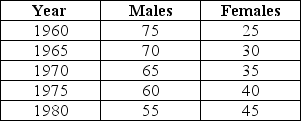 TABLE 30-4
Refer to Table 30-4.Suppose that for each year listed the unemployment rate among males is 5% while it is 7% among females.What is the economy's NAIRU in 1960?
A) 5.0%
B) 5.5%
C) 5.6%
D) 5.7%
E) 5.8%
Correct Answer:

Verified
Correct Answer:
Verified
Q41: A decrease in the share of the
Q42: Which of the following would be the
Q43: According to 2018 data,unemployment rates for females
Q44: Suppose the official rate of unemployment reported
Q45: Suppose that unemployed workers searching to replace
Q47: When the actual unemployment rate is equal
Q48: The table below provides hypothetical unemployment,employment,and labour
Q49: The labour market in the diagram below
Q50: The table below shows the percentage of
Q51: Which of the following would be the