Multiple Choice
The table below shows the percentage of the labour force accounted for by males and females over a two-decade period.Assume that real GDP is equal to potential in each of the given years. % of Labour Force 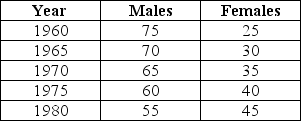 TABLE 30-4
Refer to Table 30-4.Suppose that for each year listed the unemployment rate among males is 5% while it is 7% among females.By how much does this economy's NAIRU change between 1960 and 1975?
A) It decreases by 1 percentage point.
B) It remains the same.
C) It increases by 0.5 percentage point.
D) It increases by 0.3 percentage point.
E) It increases by 0.2 percentage point.
Correct Answer:

Verified
Correct Answer:
Verified
Q45: Suppose that unemployed workers searching to replace
Q46: The table below shows the percentage of
Q47: When the actual unemployment rate is equal
Q48: The table below provides hypothetical unemployment,employment,and labour
Q49: The labour market in the diagram below
Q51: Which of the following would be the
Q52: Some economists argue that increases in labour-force
Q53: Which statement by an employer is consistent
Q54: As Canada continues to become more integrated
Q55: The main difference between market-clearing and non-market-clearing