Multiple Choice
The table below shows data for five economies of similar size.Real GDP is measured in billions of dollars.Assume that potential output for each economy is $340 billion. 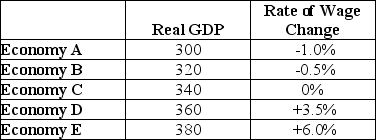 TABLE 24-1 Refer to Table 24-1.Which of the economies is operating at its long-run equilibrium?
A) Economy A
B) Economy B
C) Economy C
D) Economy D
E) Economy E
Correct Answer:

Verified
Correct Answer:
Verified
Q5: <img src="https://d2lvgg3v3hfg70.cloudfront.net/TB7713/.jpg" alt=" FIGURE 24-2 Refer
Q6: <img src="https://d2lvgg3v3hfg70.cloudfront.net/TB7713/.jpg" alt=" FIGURE 24-5 Refer
Q7: The "long-run aggregate supply curve," vertical at
Q8: Suppose the economy is initially in a
Q9: The diagram below shows an AD/AS model
Q11: An important assumption in the AD/AS macro
Q12: Consider the basic AD/AS macro model,initially in
Q13: Suppose the economy is experiencing a significant
Q14: When we study the adjustment process in
Q15: Suppose Canada's economy is in a long-run