Multiple Choice
The diagram below shows an AD/AS model for a hypothetical economy.The economy begins in long-run equilibrium at point A. 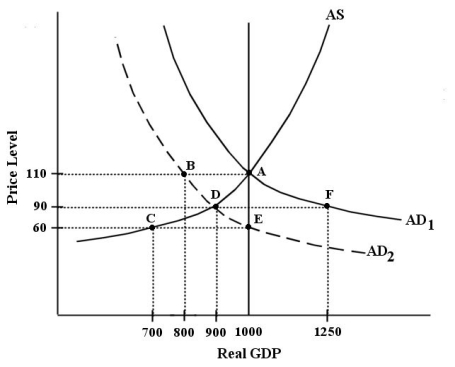 FIGURE 24-3 Refer to Figure 24-3.A negative shock to the economy shifts the AD curve from
  to
to  .The initial effect is
A) a recessionary output gap of 100.
B) a recessionary output gap of 300.
C) a recessionary output gap of 550.
D) an inflationary output gap of 200.
E) an inflationary output gap of 100.
Correct Answer:

Verified
Correct Answer:
Verified
Q4: Consider the AD/AS macro model.Why do we
Q5: <img src="https://d2lvgg3v3hfg70.cloudfront.net/TB7713/.jpg" alt=" FIGURE 24-2 Refer
Q6: <img src="https://d2lvgg3v3hfg70.cloudfront.net/TB7713/.jpg" alt=" FIGURE 24-5 Refer
Q7: The "long-run aggregate supply curve," vertical at
Q8: Suppose the economy is initially in a
Q10: The table below shows data for five
Q11: An important assumption in the AD/AS macro
Q12: Consider the basic AD/AS macro model,initially in
Q13: Suppose the economy is experiencing a significant
Q14: When we study the adjustment process in