Multiple Choice
The diagrams below show the import,export,and net export functions for an economy. 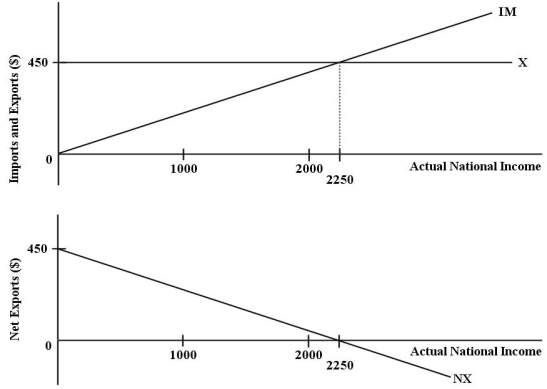 FIGURE 22-1 Refer to Figure 22-1.The function for desired imports for this economy can be expressed as
A) NX = 450 - Y.
B) IM = 450 - 0.5(Y) .
C) NX = 0.5(Y) .
D) IM = 0.5(Y) .
E) IM = 0.2(Y) .
Correct Answer:

Verified
Correct Answer:
Verified
Q2: Consider the following news headline: "Government follows
Q3: Consider the net tax rate,denoted by t.Which
Q4: The diagram below shows desired aggregate expenditure
Q5: Consider the net export function (NX).An increase
Q6: The diagram below shows desired aggregate expenditure
Q8: The diagram below shows desired aggregate expenditure
Q9: In a simple macro model with a
Q10: A fall in domestic prices relative to
Q11: <img src="https://d2lvgg3v3hfg70.cloudfront.net/TB7713/.jpg" alt=" FIGURE 22-4 Refer
Q12: <img src="https://d2lvgg3v3hfg70.cloudfront.net/TB7713/.jpg" alt=" FIGURE 22-5 Refer