Multiple Choice
The diagram below shows desired aggregate expenditure for a hypothetical economy.Assume the following features of this economy: • marginal propensity to consume (mpc) = 0.75
• net tax rate (t) = 0.20
• no foreign trade
• fixed price level
• all expenditure and income figures are in billions of dollars. 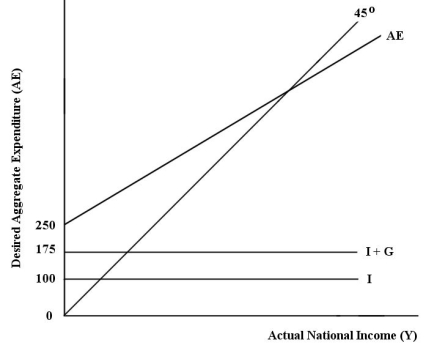 FIGURE 22-2
Refer to Figure 22-2.Which of the following equations describes the aggregate expenditure function for this economy?
A) AE = 250 + (0.6) Y
B) AE = 225 + (0.75) Y
C) AE = 250 +(0.15) Y
D) AE = 75 + (0.75) Y + (0.2) YD
E) AE = 250 +(0.75) Y + (0.2) YD
Correct Answer:

Verified
Correct Answer:
Verified
Q1: Consider the following news headline: "Business community
Q2: Consider the following news headline: "Government follows
Q3: Consider the net tax rate,denoted by t.Which
Q4: The diagram below shows desired aggregate expenditure
Q5: Consider the net export function (NX).An increase
Q7: The diagrams below show the import,export,and net
Q8: The diagram below shows desired aggregate expenditure
Q9: In a simple macro model with a
Q10: A fall in domestic prices relative to
Q11: <img src="https://d2lvgg3v3hfg70.cloudfront.net/TB7713/.jpg" alt=" FIGURE 22-4 Refer