Multiple Choice
The table below shows total output for an economy over 3 years. 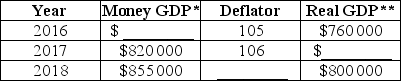 * millions of dollars ** real GDP measured in millions of 2010 dollars
TABLE 20-7
Refer to Table 20-7.The growth rate of real output from 2017 to 2018 is
A) 1.03%.
B) 1.84%.
C) 3.25%.
D) 3.41%.
E) 4.27%.
Correct Answer:

Verified
Correct Answer:
Verified
Q38: The table below shows the total output
Q39: The table below shows total output for
Q40: Consider the circular flow of income and
Q41: Consider Canada's GDP deflator and Consumer Price
Q42: The table below includes data for a
Q44: <img src="https://d2lvgg3v3hfg70.cloudfront.net/TB7713/.jpg" alt=" FIGURE 20-1 Refer
Q45: Which of the following purchases by households
Q46: When calculating GDP from the expenditure side,"actual
Q47: The table below shows total output for
Q48: Measures of GDP may understate the economic