Multiple Choice
The table below shows total output for an economy over 2 years. 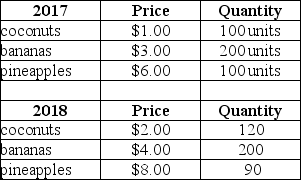 TABLE 20-8 Refer to Table 20-8.The real GDP in 2018,expressed in 2017 prices,was
A) $1760.
B) $1500.
C) $1300.
D) $1260.
E) $410.
Correct Answer:

Verified
Correct Answer:
Verified
Q34: When computing GDP from the expenditure side,which
Q35: When calculating GDP from the income side,which
Q36: <img src="https://d2lvgg3v3hfg70.cloudfront.net/TB7713/.jpg" alt=" FIGURE 20-1 Refer
Q37: When calculating GDP from the expenditure side,which
Q38: The table below shows the total output
Q40: Consider the circular flow of income and
Q41: Consider Canada's GDP deflator and Consumer Price
Q42: The table below includes data for a
Q43: The table below shows total output for
Q44: <img src="https://d2lvgg3v3hfg70.cloudfront.net/TB7713/.jpg" alt=" FIGURE 20-1 Refer