Multiple Choice
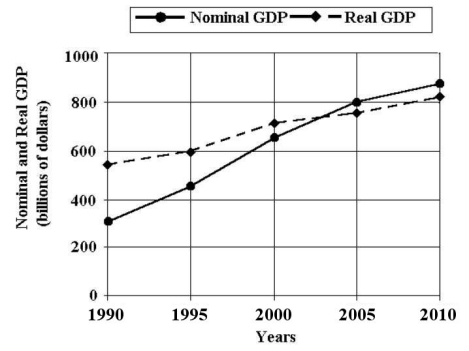 FIGURE 20-1 Refer to Figure 20-1.Real GDP increased by approximately ________% between 1995 and 2010.
A) 9
B) 17
C) 35
D) 52
E) 75
Correct Answer:

Verified
Correct Answer:
Verified
Related Questions
Q31: The table below includes data for a
Q32: Consider Canada's GDP deflator and Consumer Price
Q33: When calculating GDP from the expenditure side,how
Q34: When computing GDP from the expenditure side,which
Q35: When calculating GDP from the income side,which
Q37: When calculating GDP from the expenditure side,which
Q38: The table below shows the total output
Q39: The table below shows total output for
Q40: Consider the circular flow of income and
Q41: Consider Canada's GDP deflator and Consumer Price