Multiple Choice
The table below shows hypothetical data for volumes of e-books and hardcover books sold over a 3-year period in a particular city. 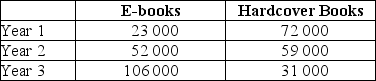 TABLE 2-3 Refer to Table 2-3.Between Year 1 and Year 3,what is the percentage change in sales of e-books?
A) 83 000%
B) 460.9%
C) 360.9%
D) 21.7%
E) 83%
Correct Answer:

Verified
Correct Answer:
Verified
Q37: The table below shows hypothetical data for
Q38: Which of the following is a normative
Q39: The table below shows hypothetical data for
Q40: Suppose economists at the World Bank discover
Q41: On a coordinate graph with y on
Q43: Choose the answer that best explains why
Q44: When an economist assumes that the owners
Q45: An economist has data showing Canadian GDP
Q46: The table below shows hypothetical tuition costs
Q47: An economist has data showing household income