Multiple Choice
The table below shows hypothetical tuition costs at a Canadian university. 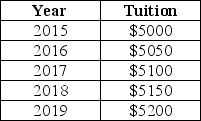 TABLE 2-1 Refer to Table 2-1.The increase in tuition fees from 2015 to 2019 is
A) 200.
B) 100/5000.
C) 4%.
D) 0.04%.
E) 200/5200.
Correct Answer:

Verified
Correct Answer:
Verified
Q41: On a coordinate graph with y on
Q42: The table below shows hypothetical data for
Q43: Choose the answer that best explains why
Q44: When an economist assumes that the owners
Q45: An economist has data showing Canadian GDP
Q47: An economist has data showing household income
Q48: <img src="https://d2lvgg3v3hfg70.cloudfront.net/TB7713/.jpg" alt=" FIGURE 2-2 Refer
Q49: The table below shows hypothetical prices for
Q50: <img src="https://d2lvgg3v3hfg70.cloudfront.net/TB7713/.jpg" alt=" FIGURE 2-3 Refer
Q51: Consider the functional relationship between two variables,X