Multiple Choice
The table below shows hypothetical prices for a particular anatomy textbook at a university bookstore over several years. 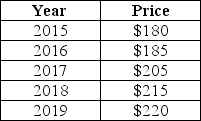 TABLE 2-4 Refer to Table 2-4.The increase in the price of the textbook from 2015 to 2019 is
A) -40.
B) 40.
C) 18.2%.
D) 22.2%.
E) 40%.
Correct Answer:

Verified
Correct Answer:
Verified
Q50: <img src="https://d2lvgg3v3hfg70.cloudfront.net/TB7713/.jpg" alt=" FIGURE 2-3 Refer
Q51: Consider the functional relationship between two variables,X
Q52: In order to test a theory,one must<br>A)develop
Q53: Most economists believe that economic analysis _
Q54: According to the Bank of Canada's website,Canada's
Q56: Suppose that over a 12-month period,Sonali's income
Q57: On a coordinate graph with y on
Q58: On a coordinate graph with y on
Q59: Which of the following best describes a
Q60: Figure 2-5 shows monthly average (per unit)production