Multiple Choice
Figure 2-5 shows monthly average (per unit) production costs for producing Good X. 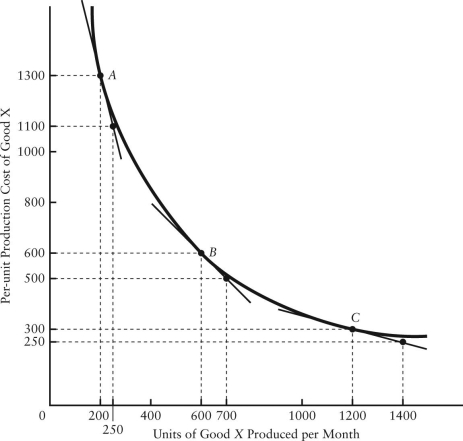 FIGURE 2-5 Refer to Figure 2-5.What is the slope of this non-linear function when 600 units per month are being produced?
A) -2
B) 4
C) -4
D) 1
E) -1
Correct Answer:

Verified
Correct Answer:
Verified
Related Questions
Q55: The table below shows hypothetical prices for
Q56: Suppose that over a 12-month period,Sonali's income
Q57: On a coordinate graph with y on
Q58: On a coordinate graph with y on
Q59: Which of the following best describes a
Q61: Suppose an individual wheat farmer's income is
Q62: Figure 2-5 shows monthly average (per unit)production
Q63: An economic model that contains a highly
Q64: When it is said that variable A
Q65: Economists at the Department of Finance in