Multiple Choice
The table below shows hypothetical data for the volume of gold and nickel output across several years. 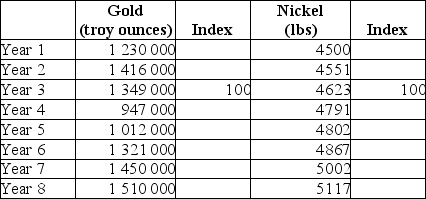 TABLE 2-5 Refer to Table 2-5.What is the index number for gold output in Year 1?
A) 0.91
B) 109.7
C) 1.097
D) 91.2
E) 99.7
Correct Answer:

Verified
Correct Answer:
Verified
Q18: Suppose Jillian will spend $250 on books
Q19: An economist collects data comparing per-capita expenditures
Q20: The table below shows the approximate value
Q21: The slope of a curve is<br>A)always positive.<br>B)always
Q22: The table below shows hypothetical tuition costs
Q24: If a theory's prediction is tested and
Q25: Of the following,which is the most important
Q26: The table below shows hypothetical monthly cell
Q27: On a coordinate graph with y on
Q28: <img src="https://d2lvgg3v3hfg70.cloudfront.net/TB7713/.jpg" alt=" FIGURE 2-4 Refer