Multiple Choice
The table below shows the approximate value of Canada's crude oil and natural gas exports over a 5-year period.The amounts shown are billions of dollars. 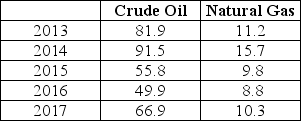 TABLE 2-7 Refer to Table 2-7.Assume that 2013 is the base year,with an index number = 100.What is the index number for the value of crude oil exports in 2017?
A) 1.22
B) 122.4
C) 122.4%
D) 0.817
E) 81.7
Correct Answer:

Verified
Correct Answer:
Verified
Q15: In a co-ordinate graph with Y on
Q16: An economist has data showing Canadian disposable
Q17: Suppose a particular theory predicts that on
Q18: Suppose Jillian will spend $250 on books
Q19: An economist collects data comparing per-capita expenditures
Q21: The slope of a curve is<br>A)always positive.<br>B)always
Q22: The table below shows hypothetical tuition costs
Q23: The table below shows hypothetical data for
Q24: If a theory's prediction is tested and
Q25: Of the following,which is the most important