Multiple Choice
The table below shows hypothetical data for the volume of gold and nickel output across several years. 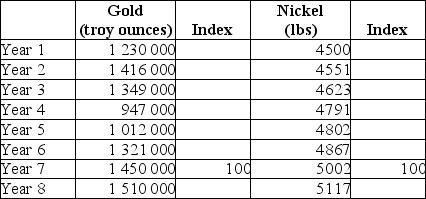 TABLE 2-6 Refer to Table 2-6.What is the index number for nickel output in Year 5?
A) -200
B) -200%
C) 96
D) 0.96%
E) 96%
Correct Answer:

Verified
Correct Answer:
Verified
Q113: You have collected data over the summer
Q114: Suppose we observe that consumption of electricity
Q115: Which of the following pairs of words
Q116: Which is the best description of positive
Q117: The table below shows hypothetical tuition costs
Q119: <img src="https://d2lvgg3v3hfg70.cloudfront.net/TB7713/.jpg" alt=" FIGURE 2-3 Refer
Q120: <img src="https://d2lvgg3v3hfg70.cloudfront.net/TB7713/.jpg" alt=" FIGURE 2-3 Refer
Q121: The table below shows the approximate value
Q122: Positively related variables change such that as
Q123: An economic theory requires,among other things,<br>A)a set