menu-iconExamlexExamLexServices

Discover

Ask a Question
  1. All Topics
  2. Topic
    Business
  3. Study Set
    Macroeconomics
  4. Exam
    Exam 2: Economic Theories, data, and Graphs
  5. Question
    FIGURE 2-3 Refer to Figure 2-3
Solved

FIGURE 2-3 Refer to Figure 2-3

Question 120

Question 120

Multiple Choice

  FIGURE 2-3 Refer to Figure 2-3.At X<sub>2</sub> on curve B,the A) maximum occurs at Y<sub>1</sub>. B) minimum occurs at Y<sub>4.</sub> C) slope of the curve is zero. D) slope is increasing. E) slope is decreasing. 
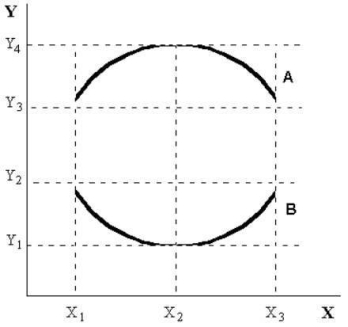
FIGURE 2-3 Refer to Figure 2-3.At X2 on curve B,the


A) maximum occurs at Y1.
B) minimum occurs at Y4.
C) slope of the curve is zero.
D) slope is increasing.
E) slope is decreasing.

Correct Answer:

verifed

Verified

Unlock this answer now
Get Access to more Verified Answers free of charge

Related Questions

Q115: Which of the following pairs of words

Q116: Which is the best description of positive

Q117: The table below shows hypothetical tuition costs

Q118: The table below shows hypothetical data for

Q119: <img src="https://d2lvgg3v3hfg70.cloudfront.net/TB7713/.jpg" alt=" FIGURE 2-3 Refer

Q121: The table below shows the approximate value

Q122: Positively related variables change such that as

Q123: An economic theory requires,among other things,<br>A)a set

Q124: Suppose there is a linear relationship between

Q125: Data collected of several variables but for

Examlex

ExamLex

About UsContact UsPerks CenterHomeschoolingTest Prep

Work With Us

Campus RepresentativeInfluencers

Links

FaqPricingChrome Extension

Download The App

Get App StoreGet Google Play

Policies

Privacy PolicyTerms of ServiceHonor CodeCommunity Guidelines

Scan To Download

qr-code

Copyright © (2025) ExamLex LLC.

Privacy PolicyTerms Of ServiceHonor CodeCommunity Guidelines