Multiple Choice
The table below shows hypothetical data for the volume of gold and nickel output across several years. 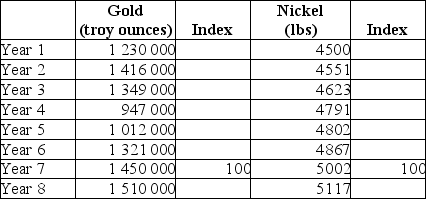 TABLE 2-6 Refer to Table 2-6.What is the percentage change in gold output from Year 1 to Year 7?
A) 17.9%
B) 84.8%
C) 15.2%
D) -15.2%
E) 0.152%
Correct Answer:

Verified
Correct Answer:
Verified
Related Questions
Q84: On a coordinate graph with y on
Q85: The table below shows the approximate value
Q86: The table below shows hypothetical tuition costs
Q87: A positive statement is one that states<br>A)what
Q88: The table below shows hypothetical monthly cell
Q90: For a given year,an index number of
Q91: Suppose there is a linear relationship between
Q92: The table below shows hypothetical data for
Q93: The table below shows hypothetical data for
Q94: When an increase in one variable is