Multiple Choice
The table below shows hypothetical data for volumes of e-books and hardcover books sold over a 3-year period in a particular city. 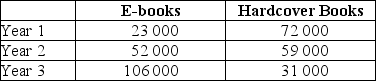 TABLE 2-3 Refer to Table 2-3.Suppose we choose Year 1 as the base year and construct a series of index numbers with which to analyze the sales data.The index numbers for volumes of e-books sold (starting with Year 1) is
A) 100; 44.2; 21.7.
B) 100; 226.1; 460.9.
C) 23 000; 52 000; 106 000.
D) 100; 126.1; 360.1.
E) 1; 0.442; 0.217.
Correct Answer:

Verified
Correct Answer:
Verified
Q87: A positive statement is one that states<br>A)what
Q88: The table below shows hypothetical monthly cell
Q89: The table below shows hypothetical data for
Q90: For a given year,an index number of
Q91: Suppose there is a linear relationship between
Q93: The table below shows hypothetical data for
Q94: When an increase in one variable is
Q95: Suppose there is a theory that several
Q96: Figure 2-5 shows monthly average (per unit)production
Q97: The statement that introducing a policy of