Multiple Choice
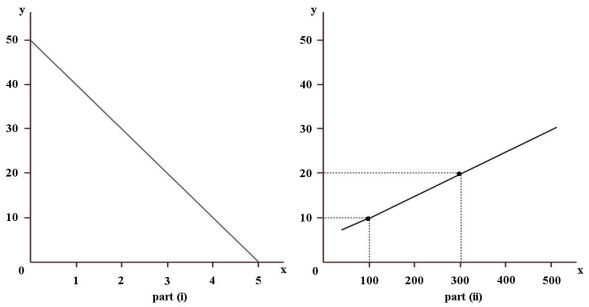 FIGURE 2-1 Refer to Figure 2-1.What is the slope of the line in part (ii) of the figure?
A) 12.5
B) -12.5
C) 1
D) 0.05
E) 0.08
Correct Answer:

Verified
Correct Answer:
Verified
Related Questions
Q1: The statement that a country's rate of
Q2: Suppose there is a linear relationship between
Q3: The base year for an index number
Q4: Which of the following statements belongs more
Q6: Suppose Ahmoud would spend $1200 per year
Q7: Suppose we have data for 1000 students
Q8: <img src="https://d2lvgg3v3hfg70.cloudfront.net/TB7713/.jpg" alt=" FIGURE 2-4 Refer
Q9: The table below shows hypothetical monthly cell
Q10: Negatively related variables change such that as
Q11: The table below shows the approximate value