Multiple Choice
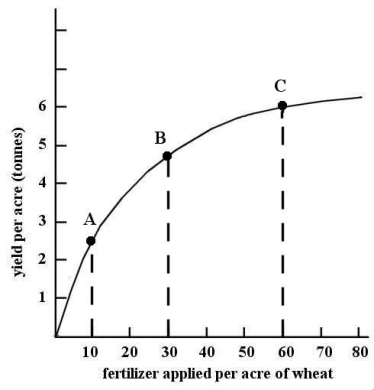 FIGURE 2-4 Refer to Figure 2-4.This non-linear function shows that over the range shown,
A) as more fertilizer is applied,the marginal response in yield is increasing
B) as more fertilizer is applied,the marginal change in yield is diminishing.
C) as the yield per acre increases,the amount of fertilizer required per acre is diminishing.
D) as the yield per acre increases,the amount of fertilizer required per acre is increasing.
E) as more fertilizer is applied,the total yield per acre is diminishing.
Correct Answer:

Verified
Correct Answer:
Verified
Q3: The base year for an index number
Q4: Which of the following statements belongs more
Q5: <img src="https://d2lvgg3v3hfg70.cloudfront.net/TB7713/.jpg" alt=" FIGURE 2-1 Refer
Q6: Suppose Ahmoud would spend $1200 per year
Q7: Suppose we have data for 1000 students
Q9: The table below shows hypothetical monthly cell
Q10: Negatively related variables change such that as
Q11: The table below shows the approximate value
Q12: Consider the following equation: Y = 10
Q13: <img src="https://d2lvgg3v3hfg70.cloudfront.net/TB7713/.jpg" alt=" FIGURE 2-4 Refer