Multiple Choice
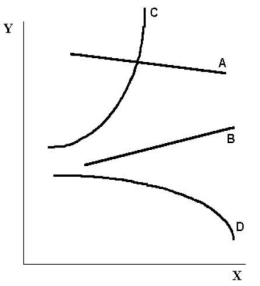 FIGURE 2-2 Refer to Figure 2-2.The slope of curve D is
A) positive and constant.
B) negative and constant.
C) positive and changing.
D) negative and changing.
E) undefined.
Correct Answer:

Verified
Correct Answer:
Verified
Related Questions
Q43: Choose the answer that best explains why
Q44: When an economist assumes that the owners
Q45: An economist has data showing Canadian GDP
Q46: The table below shows hypothetical tuition costs
Q47: An economist has data showing household income
Q49: The table below shows hypothetical prices for
Q50: <img src="https://d2lvgg3v3hfg70.cloudfront.net/TB7713/.jpg" alt=" FIGURE 2-3 Refer
Q51: Consider the functional relationship between two variables,X
Q52: In order to test a theory,one must<br>A)develop
Q53: Most economists believe that economic analysis _