Multiple Choice
The diagram below shows two production possibilities boundaries for Country X. 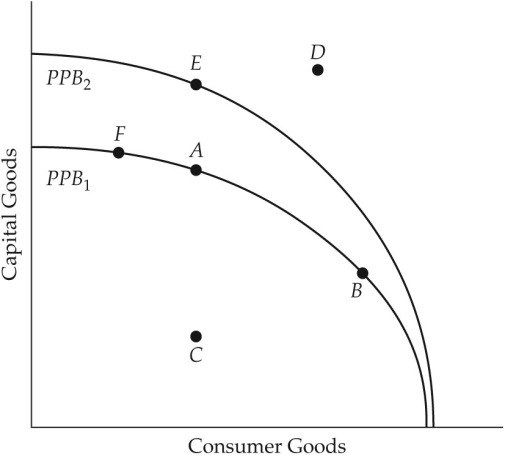 FIGURE 1-4 Refer to Figure 1-4.The production possibilities boundaries are drawn concave to the origin.What does this shape of the PPB demonstrate?
A) the decreasing opportunity cost of producing more of either good
B) the scarcity of resources in the economy
C) the constant opportunity cost of producing more of either good
D) the unfair distribution of resources in the economy
E) the increasing opportunity cost of producing more of either good
Correct Answer:

Verified
Correct Answer:
Verified
Q96: Consider the following factors of production: -
Q97: Suppose you own a courier service and
Q98: With a budget of $500 000,a school
Q99: A point lying inside the production possibilities
Q100: With a budget of $500 000,a school
Q102: The downward-sloping line in the diagram below
Q103: A move from inside the production possibilities
Q104: The diagram below shows two production possibilities
Q105: The diagram below shows two production possibilities
Q106: In mixed economies,economic behaviour is<br>A)largely determined by