Multiple Choice
The diagram below shows two production possibilities boundaries for Country X. 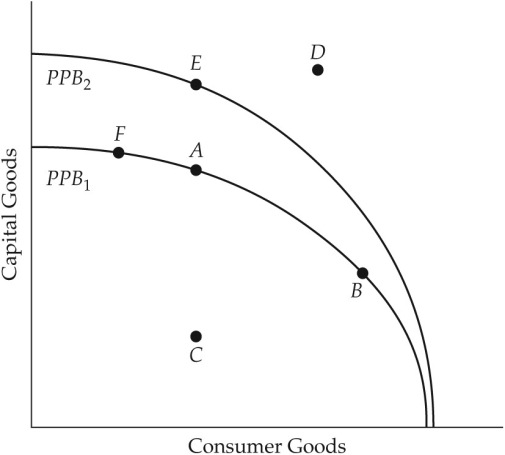 FIGURE 1-4 Refer to Figure 1-4.An outward shift of the production possibilities boundary from
  to
to  indicates which of the following?
A) an increase in the price of raw materials for consumer goods
B) growth in the country's productive capacity
C) an increase in the price of raw material for capital goods
D) more of the country's resources are being used
E) the country's resources are being used less efficiently
Correct Answer:

Verified
Correct Answer:
Verified
Q100: With a budget of $500 000,a school
Q101: The diagram below shows two production possibilities
Q102: The downward-sloping line in the diagram below
Q103: A move from inside the production possibilities
Q104: The diagram below shows two production possibilities
Q106: In mixed economies,economic behaviour is<br>A)largely determined by
Q107: Suppose there are only three alternatives to
Q108: If an economy exhibits the specialization of
Q109: On a diagram of a production possibilities
Q110: An economic system that relies primarily upon