Multiple Choice
The diagram below shows two production possibilities boundaries for Country X. 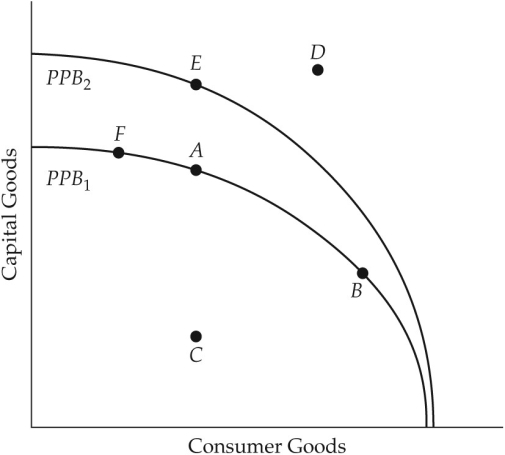 FIGURE 1-4 Refer to Figure 1-4.If Country X is currently producing at point A,it could move to point B if
A) the cost of producing capital goods were to increase.
B) some resources were switched from the capital goods industries to the consumer goods industries.
C) the cost of producing consumer goods were to increase.
D) some resources were switched from the consumer goods industries to the capital goods industries.
E) Country X is no longer able to produce the quantity of capital goods at point A.
Correct Answer:

Verified
Correct Answer:
Verified
Q46: Consider Canada's production possibilities boundary.Suppose fire destroys
Q47: With a budget of $500 000,a school
Q48: Suppose you own a courier service and
Q49: The diagram below shows two production possibilities
Q50: With a budget of $200 million,the government
Q52: If some income earned by households is
Q53: A farmer selling tomatoes and corn at
Q54: The world price of oil fell in
Q55: On a diagram of a production possibilities
Q56: Consider Canada's production possibilities boundary.Suppose a scientific