Multiple Choice
The diagram below shows two production possibilities boundaries for Country X. 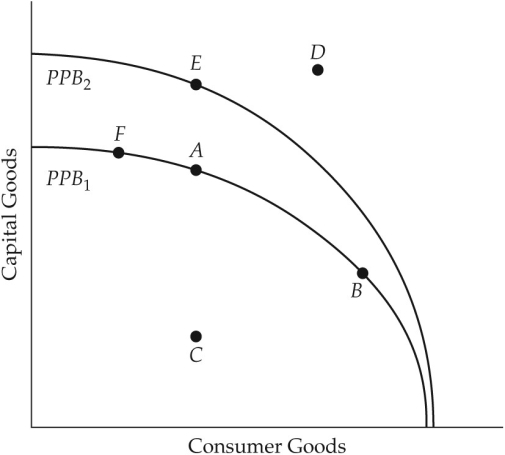 FIGURE 1-4 Refer to Figure 1-4.Suppose Country X is currently producing at point E.Country X could achieve production at point D if
A) the given resources were fully employed.
B) the given resources were more efficiently employed.
C) sufficient improvements in technology occurred in either the capital goods industry or the consumer goods industries.
D) firms reduced output of capital goods.
E) the prices of capital goods and consumption goods fell.
Correct Answer:

Verified
Correct Answer:
Verified
Q44: The diagram below shows two production possibilities
Q45: Which of the following is NOT considered
Q46: Consider Canada's production possibilities boundary.Suppose fire destroys
Q47: With a budget of $500 000,a school
Q48: Suppose you own a courier service and
Q50: With a budget of $200 million,the government
Q51: The diagram below shows two production possibilities
Q52: If some income earned by households is
Q53: A farmer selling tomatoes and corn at
Q54: The world price of oil fell in