Multiple Choice
The following graph shows the demands and marginal revenue in two markets,1 and 2,for a price discriminating firm along with total marginal revenue,MRT,and marginal cost. 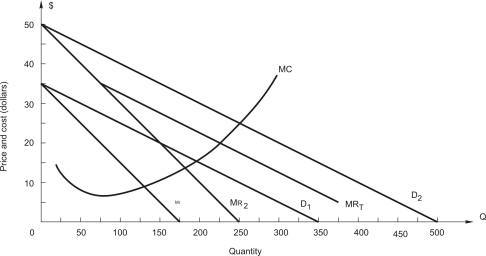 How should the firm allocate sales between the two markets?
A) 150 in each market
B) 100 in market 1,175 in 2
C) 150 in market 1,300 in 2
D) 112.5 in each market
E) 75 in market 1,150 in 2
Correct Answer:

Verified
Correct Answer:
Verified
Q44: The following graph shows the demands and
Q45: <img src="https://d2lvgg3v3hfg70.cloudfront.net/TB7882/.jpg" alt=" The
Q46: A firm sells its product to two
Q47: A news magazine offers students a discount
Q48: The following graph shows the demands and
Q50: In order to maximize profit,a firm that
Q51: A firm is producing two goods
Q52: A firm sells its product to two
Q53: A firm is producing two goods
Q54: A firm faces the demand for