Multiple Choice
The following graph shows the demands and marginal revenue in two markets,1 and 2,for a price discriminating firm along with total marginal revenue,MRT,and marginal cost. 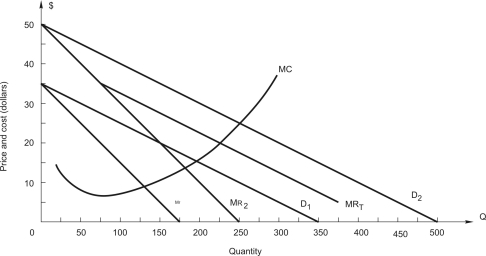 At the optimal price and quantity,what is demand elasticity in each market?
A) E1 = -3.67,E2 = -2.33
B) E1 = -3,E2 = -4
C) E1 = -2.5,E2 = -3.5
D) E1 = -3,E2 =-3
E) E1 = -1.67,E2 = -2.33
Correct Answer:

Verified
Correct Answer:
Verified
Q39: In order to maximize profit,a firm producing
Q40: Black Diamond Tennis & Golf Club
Q41: <img src="https://d2lvgg3v3hfg70.cloudfront.net/TB7882/.jpg" alt=" The
Q42: A firm faces the demand for
Q43: A firm sells its product to two
Q45: <img src="https://d2lvgg3v3hfg70.cloudfront.net/TB7882/.jpg" alt=" The
Q46: A firm sells its product to two
Q47: A news magazine offers students a discount
Q48: The following graph shows the demands and
Q49: The following graph shows the demands and