Multiple Choice
The following figure shows the demand and cost curves facing a firm with market power in the short run. 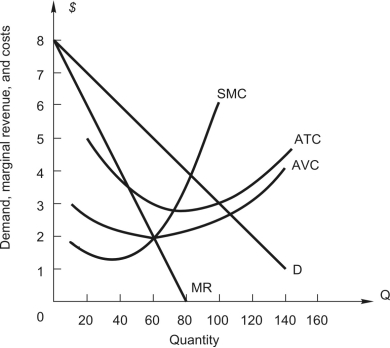 The profit-maximizing level of output is
A) 60 units.
B) 70 units
C) 80 units
D) 90 units.
E) 100 units.
Correct Answer:

Verified
Correct Answer:
Verified
Q82: <img src="https://d2lvgg3v3hfg70.cloudfront.net/TB7882/.jpg" alt=" The figure above
Q83: A firm with two plants,A and
Q84: If a monopolist is producing a level
Q85: A firm with market power faces
Q86: <img src="https://d2lvgg3v3hfg70.cloudfront.net/TB7882/.jpg" alt=" The figure above
Q88: A firm is producing 10,000 units of
Q89: If a monopolistically competitive market is in
Q90: Using time-series data,the demand function for
Q91: The market demand for a monopoly
Q92: In a monopolistically competitive market,<br>A)firms are small