Multiple Choice
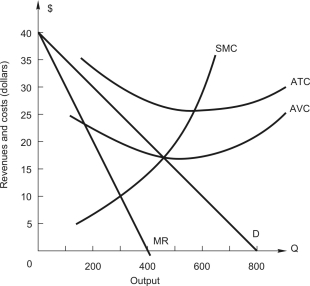 The figure above shows the demand and cost curves facing a price-setting firm.In profit-maximizing (or loss-minimizing) equilibrium,the price-setting firm earns $______ in total revenue,which is ___________ the maximum possible total revenue of $________.
A) $7,500; equal to; $7,500
B) $8,000; more than; $7,500
C) $7,650; less than; $8,000
D) $8,000; equal to; $8,000
E) $7,500; less than; $8,000
Correct Answer:

Verified
Correct Answer:
Verified
Q77: A firm with market power faces
Q78: <img src="https://d2lvgg3v3hfg70.cloudfront.net/TB7882/.jpg" alt=" The figure above
Q79: A manager of a firm with market
Q80: <img src="https://d2lvgg3v3hfg70.cloudfront.net/TB7882/.jpg" alt=" The figure above
Q81: <img src="https://d2lvgg3v3hfg70.cloudfront.net/TB7882/.jpg" alt=" The graph above
Q83: A firm with two plants,A and
Q84: If a monopolist is producing a level
Q85: A firm with market power faces
Q86: <img src="https://d2lvgg3v3hfg70.cloudfront.net/TB7882/.jpg" alt=" The figure above
Q87: The following figure shows the demand and