Multiple Choice
The following figure shows the demand and cost curves facing a firm with market power in the short run. 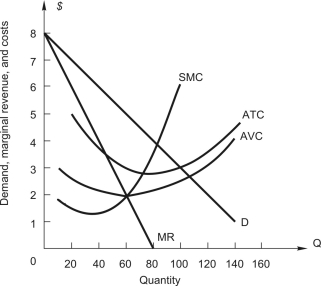 The firm will sell its output at a price of
A) $2.
B) $3.
C) $3.75.
D) $5.
E) $6.
Correct Answer:

Verified
Correct Answer:
Verified
Q59: The market demand for a monopoly
Q60: Refer to the following figure showing demand
Q61: <img src="https://d2lvgg3v3hfg70.cloudfront.net/TB7882/.jpg" alt=" The figure above
Q62: A firm with two factories,one in Michigan
Q63: A monopolistic competitor is similar to a
Q65: A firm with market power<br>A)can increase price
Q66: <img src="https://d2lvgg3v3hfg70.cloudfront.net/TB7882/.jpg" alt=" The figure above
Q67: A monopolist will maximize profit by producing
Q68: A profit-maximizing firm with market power will
Q69: A firm with two plants,A and