Multiple Choice
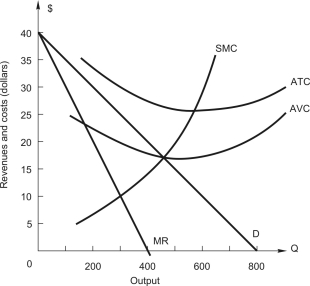 The figure above shows the demand and cost curves facing a price-setting firm.At what output is marginal revenue $20?
A) 100 units
B) 200 units
C) 300 units
D) 400 units
E) 500 units
Correct Answer:

Verified
Correct Answer:
Verified
Related Questions
Q56: <img src="https://d2lvgg3v3hfg70.cloudfront.net/TB7882/.jpg" alt=" The demand for
Q57: Refer to the following table showing
Q58: Using time-series data,the demand function for
Q59: The market demand for a monopoly
Q60: Refer to the following figure showing demand
Q62: A firm with two factories,one in Michigan
Q63: A monopolistic competitor is similar to a
Q64: The following figure shows the demand and
Q65: A firm with market power<br>A)can increase price
Q66: <img src="https://d2lvgg3v3hfg70.cloudfront.net/TB7882/.jpg" alt=" The figure above