Multiple Choice
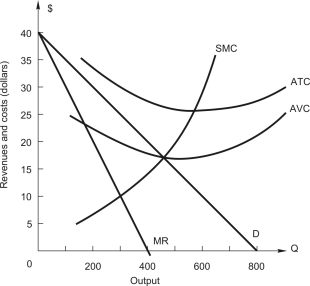 The figure above shows the demand and cost curves facing a price-setting firm.What is marginal revenue when output is 100 units?
A) $10
B) $20
C) $25
D) $30
E) $35
Correct Answer:

Verified
Correct Answer:
Verified
Q73: <img src="https://d2lvgg3v3hfg70.cloudfront.net/TB7882/.jpg" alt=" The figure above
Q74: A monopolist is currently hiring 5,000 units
Q75: A firm with two plants,A and
Q76: A firm with two plants,A and
Q77: A firm with market power faces
Q79: A manager of a firm with market
Q80: <img src="https://d2lvgg3v3hfg70.cloudfront.net/TB7882/.jpg" alt=" The figure above
Q81: <img src="https://d2lvgg3v3hfg70.cloudfront.net/TB7882/.jpg" alt=" The graph above
Q82: <img src="https://d2lvgg3v3hfg70.cloudfront.net/TB7882/.jpg" alt=" The figure above
Q83: A firm with two plants,A and