Multiple Choice
The graph below on the left shows the short-run marginal cost curve for a typical firm selling in a perfectly competitive industry.The graph on the right shows current industry demand and supply. 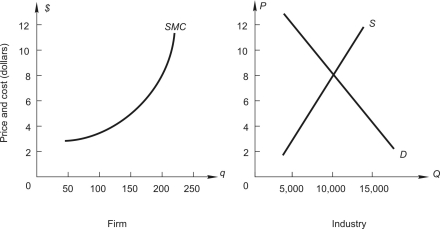 What output should the firm produce?
A) 200
B) 250
C) 150
D) 300
Correct Answer:

Verified
Correct Answer:
Verified
Q17: Which of the following CANNOT be true
Q18: <img src="https://d2lvgg3v3hfg70.cloudfront.net/TB7882/.jpg" alt=" The figure above
Q19: A competitive firm will maximize profit by
Q20: Bartech,Inc.is a firm operating in a
Q21: Good W is produced in a competitive
Q23: To answer the question,refer to the following
Q24: Radon Research Corporation (RRC)is one of
Q25: Consider a competitive industry and a
Q26: Below,the graph on the left shows long-run
Q27: Good Z is produced and sold in