Multiple Choice
Below,the graph on the left shows long-run average and marginal cost for a typical firm in a perfectly competitive industry.The graph on the right shows demand and long-run supply for an increasing-cost industry. 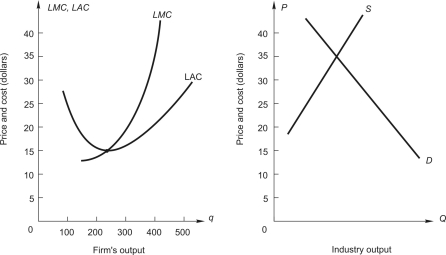 How much profit will the firm earn?
A) zero
B) $2,600
C) $3,100
D) $3,750
E) $6,000
Correct Answer:

Verified
Correct Answer:
Verified
Q21: Good W is produced in a competitive
Q22: The graph below on the left shows
Q23: To answer the question,refer to the following
Q24: Radon Research Corporation (RRC)is one of
Q25: Consider a competitive industry and a
Q27: Good Z is produced and sold in
Q28: Economic rent<br>A)is the payment to a more
Q29: Consider a competitive industry and a
Q30: Suits Only,a dry-cleaning firm that specializes in
Q31: Consider a competitive industry and a