Multiple Choice
Below,the graph on the left shows the short-run cost curves for a firm in a perfectly competitive market,and the graph on the right shows the current market conditions in this industry.What is the maximum amount of profit the firm can earn? 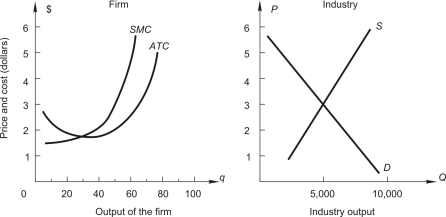
A) $ 50
B) $ 40
C) $ 80
D) $150
Correct Answer:

Verified
Correct Answer:
Verified
Q30: Suits Only,a dry-cleaning firm that specializes in
Q31: Consider a competitive industry and a
Q32: Sport Tee Corporation manufactures T-shirts bearing
Q33: The graph below shows demand and marginal
Q34: When a perfect competitive industry is in
Q36: In a competitive market characterized by increasing
Q37: <img src="https://d2lvgg3v3hfg70.cloudfront.net/TB7882/.jpg" alt=" The graph above
Q38: A consulting company estimated market demand
Q39: Bartech,Inc.is a firm operating in a
Q40: To answer the question,refer to the following