Multiple Choice
 The graph above shows cost curves for a perfectly competitive firm.The firm will break even if price is:
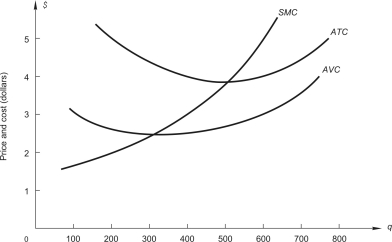
A) $2
B) $3.90
C) $5
D) $6
Correct Answer:

Verified
Correct Answer:
Verified
Related Questions
Q32: Sport Tee Corporation manufactures T-shirts bearing
Q33: The graph below shows demand and marginal
Q34: When a perfect competitive industry is in
Q35: Below,the graph on the left shows the
Q36: In a competitive market characterized by increasing
Q38: A consulting company estimated market demand
Q39: Bartech,Inc.is a firm operating in a
Q40: To answer the question,refer to the following
Q41: Total cost schedule for a competitive
Q42: <img src="https://d2lvgg3v3hfg70.cloudfront.net/TB7882/.jpg" alt=" The graph above