Multiple Choice
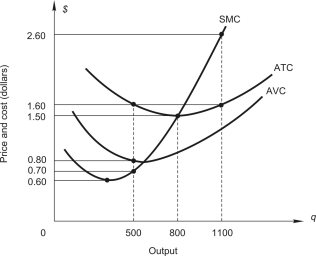 The figure above shows cost curves for a perfectly competitive firm.A profit-maximizing firm will break even when market price is:
A) $0.60
B) $0.80
C) $1.50
D) $1.60
Correct Answer:

Verified
Correct Answer:
Verified
Related Questions
Q64: Good W is produced in a competitive
Q65: To answer the question,refer to the following
Q66: Good Z is produced and sold in
Q67: Good W is produced in a competitive
Q68: Below,the graph on the left shows long-run
Q70: Bartech,Inc.is a firm operating in a
Q71: A firm in a competitive industry faces
Q72: A consulting company estimated market demand
Q73: Sport Tee Corporation manufactures T-shirts bearing
Q74: In order to minimize losses in the