Multiple Choice
Below,the graph on the left shows long-run average and marginal cost for a typical firm in a perfectly competitive industry.The graph on the right shows demand and long-run supply for an increasing-cost industry. 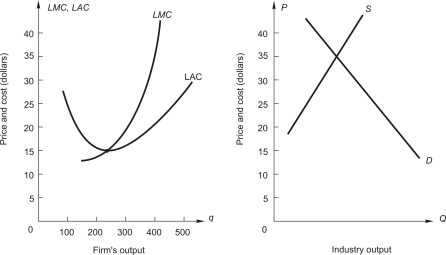 If this were an increasing cost industry,what would be the price when the industry gets to long-run competitive equilibrium?
A) between $35 and $15
B) $35
C) $15
D) below $15
E) above $35
Correct Answer:

Verified
Correct Answer:
Verified
Q63: A consulting company estimated market demand
Q64: Good W is produced in a competitive
Q65: To answer the question,refer to the following
Q66: Good Z is produced and sold in
Q67: Good W is produced in a competitive
Q69: <img src="https://d2lvgg3v3hfg70.cloudfront.net/TB7882/.jpg" alt=" The figure above
Q70: Bartech,Inc.is a firm operating in a
Q71: A firm in a competitive industry faces
Q72: A consulting company estimated market demand
Q73: Sport Tee Corporation manufactures T-shirts bearing