Multiple Choice
Refer to the following graph.The price of capital (r) is $20. 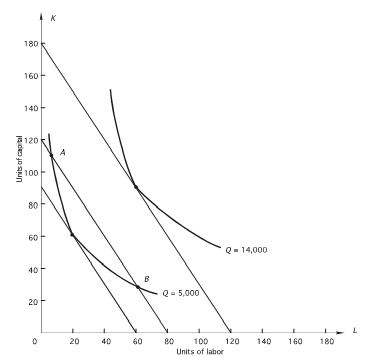 Why wouldn't the firm choose to produce 5,000 units of output with the combination at B?
A) At B,MRTS < 3/2.
B) At B,MPK / r > MPL / w.
C) At B,MPL < MPK.
D) both a and b
E) none of the above
Correct Answer:

Verified
Correct Answer:
Verified
Q37: Refer to the following graph.The price of
Q38: producer is hiring 20 units of labor
Q39: <img src="https://d2lvgg3v3hfg70.cloudfront.net/TB7882/.jpg" alt=" Given the above
Q40: Refer to the following figure.The price of
Q41: In the following graph,the price of capital
Q43: <img src="https://d2lvgg3v3hfg70.cloudfront.net/TB7882/.jpg" alt=" Given the above
Q44: Which of the following is FALSE?<br>A)A change
Q45: The marginal rate of technical substitution is<br>A)the
Q46: Refer to the following graph.The price of
Q47: In the following graph,the price of labor