Multiple Choice
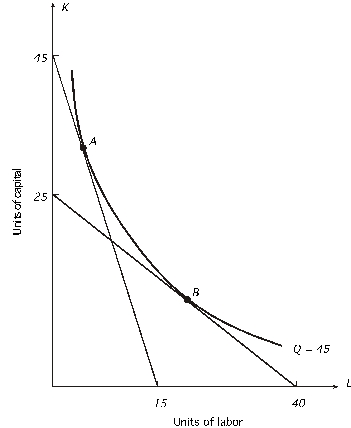 Given the above graph,what is the marginal rate of technical substitution at point A?
A) 0.3
B) 1
C) 1.125
D) 1.67
E) none of the above
Correct Answer:

Verified
Correct Answer:
Verified
Related Questions
Q34: If the price of labor rises relative
Q35: In the following graph,the price of capital
Q36: Refer to the following graph.The price of
Q37: Refer to the following graph.The price of
Q38: producer is hiring 20 units of labor
Q40: Refer to the following figure.The price of
Q41: In the following graph,the price of capital
Q42: Refer to the following graph.The price of
Q43: <img src="https://d2lvgg3v3hfg70.cloudfront.net/TB7882/.jpg" alt=" Given the above
Q44: Which of the following is FALSE?<br>A)A change