Multiple Choice
Refer to the following graph.The price of capital (r) is $20. 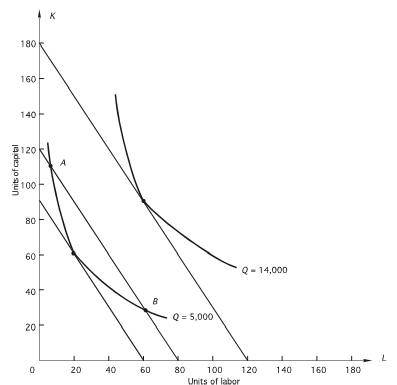 At the optimal combination of inputs for producing 14,000 units of output,what is the marginal rate of technical substitution?
A) 2.5
B) 0.67
C) 1.5
D) 0.80
E) impossible to tell from the graph
Correct Answer:

Verified
Correct Answer:
Verified
Q59: <img src="https://d2lvgg3v3hfg70.cloudfront.net/TB7882/.jpg" alt=" Given the above
Q60: Refer to the following graph.The price of
Q61: In the following graph,the price of capital
Q62: If a firm is producing the level
Q63: The expansion path<br>A)shows how the cost-minimizing input
Q65: Economies of scope in the production
Q66: Which of the following statements is true?<br>A)In
Q67: Learning economies differ from economies of scale
Q68: The slope of an isoquant is<br>A)-∆K/∆L.<br>B)MP<sub>L</sub> /
Q69: producer is hiring 20 units of labor