Multiple Choice
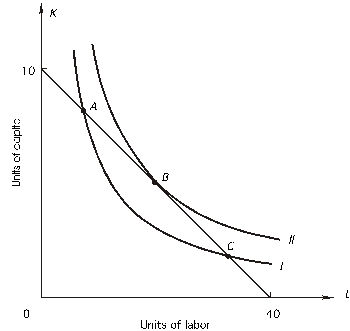 Given the above graph,the marginal rate of technical substitution at point A is
A) less than 0.25.
B) less than 4.0.
C) greater than 0.25.
D) greater than 4.0.
Correct Answer:

Verified
Correct Answer:
Verified
Related Questions
Q54: Refer to the following graph.The price of
Q55: You overhear a businessman say: "We want
Q56: Which of the following are characteristics of
Q57: Diseconomies of scale<br>A)exist when fixed cost increases
Q58: In the following graph,the price of capital
Q60: Refer to the following graph.The price of
Q61: In the following graph,the price of capital
Q62: If a firm is producing the level
Q63: The expansion path<br>A)shows how the cost-minimizing input
Q64: Refer to the following graph.The price of