Multiple Choice
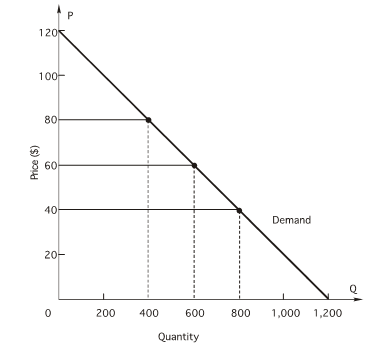 In the figure above,if price INCREASES from $60 to $80,an arrow representing the PRICE effect
A) will point upward.
B) will point downward.
C) will be longer than (and in opposite direction of) the arrow representing the quantity effect.
D) will be shorter than (and in the opposite direction of) the arrow representing the quantity effect.
E) both a and d
Correct Answer:

Verified
Correct Answer:
Verified
Q10: <img src="https://d2lvgg3v3hfg70.cloudfront.net/TB7882/.jpg" alt=" In the figure
Q11: The demand for good X will be
Q12: Which of the following would tend to
Q13: Use the figure below to calculate the
Q14: <img src="https://d2lvgg3v3hfg70.cloudfront.net/TB7882/.jpg" alt=" In the figure above,what
Q16: To answer the question,refer to the
Q17: When marginal revenue is zero,<br>A)P < MR.<br>B)P
Q18: According to the following figure,the equation for
Q19: the figure below,which shows a linear demand
Q20: The cross-price elasticity of demand between goods