menu-iconExamlexExamLexServices

Discover

Ask a Question
  1. All Topics
  2. Topic
    Business
  3. Study Set
    Managerial Economics
  4. Exam
    Exam 6: Elasticity and Demand
  5. Question
    The Figure Below,which Shows a Linear Demand Curve and the Associated
Solved

The Figure Below,which Shows a Linear Demand Curve and the Associated

Question 19

Question 19

Multiple Choice

the figure below,which shows a linear demand curve and the associated total revenue curve,to answer the question. the figure below,which shows a linear demand curve and the associated total revenue curve,to answer the question.   The marginal revenue of the 100<sup>th</sup> unit is $_____. A) 0 B) 20 C) 40 D) 50 E) cannot tell from the information provided 
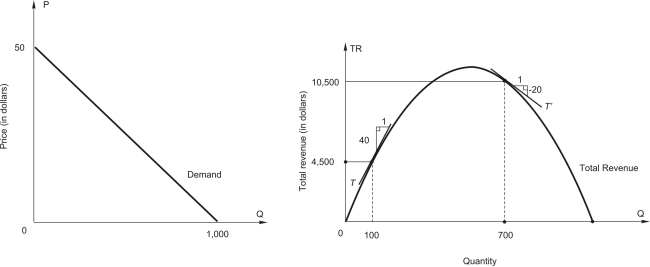
The marginal revenue of the 100th unit is $_____.


A) 0
B) 20
C) 40
D) 50
E) cannot tell from the information provided

Correct Answer:

verifed

Verified

Unlock this answer now
Get Access to more Verified Answers free of charge

Related Questions

Q14: <img src="https://d2lvgg3v3hfg70.cloudfront.net/TB7882/.jpg" alt=" In the figure above,what

Q15: <img src="https://d2lvgg3v3hfg70.cloudfront.net/TB7882/.jpg" alt=" In the figure

Q16: To answer the question,refer to the

Q17: When marginal revenue is zero,<br>A)P < MR.<br>B)P

Q18: According to the following figure,the equation for

Q20: The cross-price elasticity of demand between goods

Q21: Use the figure to calculate the income

Q22: Refer to the following figure.When price is

Q23: To answer the question,refer to the

Q24: Refer to the following graph to answer

Examlex

ExamLex

About UsContact UsPerks CenterHomeschoolingTest Prep

Work With Us

Campus RepresentativeInfluencers

Links

FaqPricingChrome Extension

Download The App

Get App StoreGet Google Play

Policies

Privacy PolicyTerms of ServiceHonor CodeCommunity Guidelines

Scan To Download

qr-code

Copyright © (2025) ExamLex LLC.

Privacy PolicyTerms Of ServiceHonor CodeCommunity Guidelines