Multiple Choice
Refer to the following graph to answer the question: 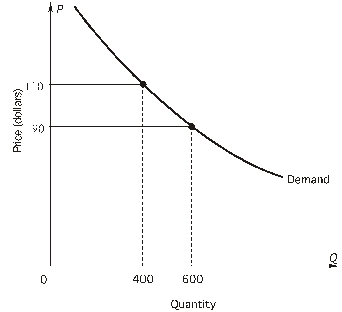 The price elasticity of demand over the price interval $90 to $110 is
A) -0.5
B) -1.0
C) -1.5
D) -2.0
E) -0.4
Correct Answer:

Verified
Correct Answer:
Verified
Related Questions
Q20: The cross-price elasticity of demand between goods
Q21: Use the figure to calculate the income
Q22: Refer to the following figure.When price is
Q23: To answer the question,refer to the
Q24: Refer to the following graph to answer
Q26: To answer the question,refer to the
Q27: Marginal revenue<br>A)is the change in total revenue
Q28: Refer to the following figure.When price is
Q29: Refer to the following figure.When quantity demanded
Q30: Total revenue increased for a firm operating